
EMU430- Data Analytics, 2023-2024 Fall Semester
Share on | Paylaş
LinkedIn Twitter
As the Department of Industrial Engineering at Hacettepe University, we are dedicated to enhancing our curriculum to align with the latest advancements in fields such as programming, data science, artificial intelligence, and more. With this goal in mind, we recently introduced the EMU430 - Data Analytics course to our curriculum. Detailed information about the course can be found here: EMU430- Data Analytics. Last fall, I was fortunate enough to immediately offer EMU430 to Hacettepe students. This course holds a special place in my heart because I designed it from the ground up, and its content aligns with the tools I use in my research and practice. My aim was to create a unique and memorable learning experience for the students, making the course as “special” as possible. The students exceeded my expectations, keeping pace with me and producing outstanding work throughout the semester. The feedback collected at the course’s conclusion further validated my observations. I am writing this article to document our experiences and share the achievements of this year with interested parties. I believe it will be beneficial for students enrolled in similar courses and for educators who teach them.
General Information on EMU430 for the 2023-2024 Fall Semester
EMU430 is a course featured in our department’s list of technical elective subjects. As such, it was available to students in their 3rd and 4th years. The course was conducted in English, in alignment with our department’s English-language curriculum. A total of 73 students enrolled in the course this semester, which is a notable figure considering our department’s capacity of 72 students, especially for an elective course. The duration of the course was 15 weeks, with one week each dedicated to a midterm exam, a final exam, and project presentations, thereby totaling 12 weeks of instructional content. The detailed curriculum for these 12 weeks is available on the EMU430- Data Analytics page. Within these 12 weeks, we invited experts in data science to enrich four of the sessions. Given the large number of participants, we opted for a classroom setup rather than a laboratory setting for our sessions. Each week, I presented relevant coding practices through live demonstrations. We emphasized extensive hands-on practice through homework, group projects, and DataCamp exercises. Although this resulted in a constant workload for the students throughout the semester, it was essential for developing proficiency in the field. With only a few exceptions, there were no significant complaints about the workload. The adage “No rose without a thorn” aptly described our journey :)
Throughout the term, we aimed to:
- Define the fundamentals of data analytics
- Provide practical experience in applying data analytics tools and techniques
- Collect and reshape raw data in different formats
- Derive meaningful conclusions from data using advanced visualizations
- Organize data analytics projects
- Use productivity tools to create reproducible reports
Our weekly syllabus covered the following topics:
- An overview of data analytics, including descriptive, predictive, and prescriptive analytics
- The basics of programming for data analytics, covering data types, vectors and vector arithmetic, indexing, conditional statements, loops and iterations, and functions
- Productivity tools for managing data analytics projects, such as git, GitHub, and the creation of reproducible reports
- Techniques in data visualization, including plot types, graphic components, layering, customization, scaling, labeling, coloring, grouping, ordering, surface creation, transformations, and visualization principles
- Methods for importing data, including spreadsheet imports and web data scraping
- Strategies for reshaping and cleaning data, such as filtering, deleting, appending, and performing join operations
- String processing techniques, including splitting, extracting, cleaning, replacing, and using regular expressions
- Approaches to text analysis
The weekly breakdown of these topics is available here: EMU430 - Data Analytics, 2023-2024 Fall Semester Syllabus
Which programming language did we use?
We conducted the course using the R programming language. I have various reasons for choosing R. First, I believe it enables individuals without programming experience to adapt to writing code more quickly, especially for students without a Computer Science background, making it a more understandable language. This is partly because its creators come from a Statistics background rather than Computer Science. For example, grasping that the first element of a vector is accessed with [1] is easier than understanding it as [0]. Similarly, selecting columns 3 to 5 of a data frame with [3:5] feels more intuitive than [2:5]. Second, the setup and transition to coding in R are quicker. I consider it an excellent prototyping language. For my own work, I often create a prototype in R and, once assured of its functionality, I may transition to Python if the project requires further development and formalization. Third, the use of Quarto for reporting, or more precisely, writing code-based reproducible reports, is a significant part of the course. It’s worth noting that Quarto can also work with Python, but it is a product of the R community. Fourth, exposing students who will inevitably encounter Python to Ras well, diversifying their knowledge of data science languages. Lastly, R holds a special place for me as my first love. Even though I now use Python for about 70% of my work, I find a unique satisfaction in R that I don’t quite get from Python.
References
For this term’s course content, I benefited from the following excellent references. I prepared my lecture notes mainly using the highly esteemed book by Dr. Rafael Irizarry’nin.
- Irizarry, Rafael A. Introduction to Data Science
- Irizarry, Rafael A. Advanced Data Science
- Charles Russel Severance. Python for Everybody
- Peng, R. D., & Matsui, E. (2016). The art of data science. A Guide for Anyone Who Works with Data. Skybrude Consulting, LLC, ISBN-978-1365061462
- Zamora Saiz, A., Quesada González, C., Hurtado Gil, L., & Mondéjar Ruiz, D. (2020). An Introduction to Data Analysis in R. Springer, Cham, Switzerland, ISBN- 978-3-030-48996-0
For my use of GitHub Classroom, I embraced the methodology employed by Dr. Berk Orbay in his BDA 503 - Essentials of Data Analytics course at MEF University. In the creation of my assignment and project guidelines, I continually drew upon the valuable resources and insights provided by him.
Key Tools That Set Our Course Apart
Git, GitHub, GitHub Classroom, and Quarto
Git and GitHub were integral to our course structure, significantly affecting how we managed the course. We utilized GitHub Classroom for administering assignments and projects throughout the term. From the outset, students were tasked with creating their own websites on GitHub, a process streamlined by the synergistic use of GitHub Classroom and Quarto, a tool for generating reproducible reports. This approach allowed students to publish their work on personal and project websites, providing a comprehensive showcase accessible to both myself and interested viewers. The use of Quarto-based web pages enabled a seamless integration of text and code, facilitating an efficient review process for me.
GitHub Classroom represents a valuable resource provided by GitHub to educators, making the setup and management of classroom assignments straightforward and seamlessly integrated with GitHub. It grants us a communal user account, EMU Hacettepe Analytics, under which students create repositories for each given assignment. This setup led to each student and project team having their own repository for their web pages.
Quarto is an adaptable documentation tool that facilitates the concurrent writing of code, data, and text in a unified document, compatible with both R and Python. The compatibility between Quarto and GitHub enhances the workflow, with students editing their Quarto-based websites locally and pushing updates to their GitHub repositories. Configuring the GitHub repository to serve the /docs branch enables GitHub to host the Quarto websites, streamlining the monitoring and evaluation of students’ progress. The project pages also follow a similar setup. Here, students focus on project work rather than individual assignments. Our project work was structured into three stages, with students refining their pages progressively with each phase. This structure has been successfully implemented by Dr. Berk Orbay in the BDA 503 - Essentials of Data Analytics course at MEF University for some time. Upon consulting Dr. Berk at the start of the term, he affirmed its effectiveness. My experience mirrored this, yielding similarly beneficial outcomes.
Invited Talks
This term, we were privileged to welcome four experts in data science to our class, resulting in an enriching experience. Details about our guest speakers are provided below.


- Cem Vardar (Ph.D.), Data Scientist, Former data scientist at Intel (2002-2010), Revionics (2010-2015) and Carvana (2015-2021), Founder of Decision Science Lab decisionsciencelab.com
- Mustafa Baydoğan (Ph.D.), Data Scientist, Associate Professor of IE Bogazici, Founder of Algopoy, www.mustafabaydogan.com/
- Baykal Hafızoğlu (Ph.D.), Data Scientist, Platform Management Director, FICO, Atlanta, USA
- Sami Serkan Özarık (Ph.D.), Data Scientist, Operations Research Scientist, Amazon, Luxembourg
The initial three presentations were delivered remotely, whereas the final session was held face-to-face. I have recorded the remote sessions and made them available on my YouTube channel. I highly recommend them to those interested. Please note that the talks are in Turkish.
DataCamp
Our course incorporated DataCamp Classroom, a feature of the DataCamp platform that offers a 6-month complimentary membership to academics and university students. Following a straightforward application and verification process, instructors are provided with a six-month free group subscription, enabling the setup of classes and full access to DataCamp’s extensive paid features. Students are invited via email to join the platform, where they gain free access to a wide range of courses and interactive coding exercises led by data science professionals for six months. Instructors have the freedom to select courses and assignments, which are then allocated as homework. Beyond these assignments, students have unrestricted access to all resources on DataCamp, facilitating a broad learning experience. The completion of tasks rewards students with XP, offering a gauge of their effort and engagement.
Over the term, I launched around 10 assignments, participation in which was optional. Yet, those who engaged received bonus points towards their final grades proportional to the number of completed assignments. Our experience with DataCamp was insightful:
- As outlined in the Syllabus, DataCamp assignments were positioned as a bonus activity.
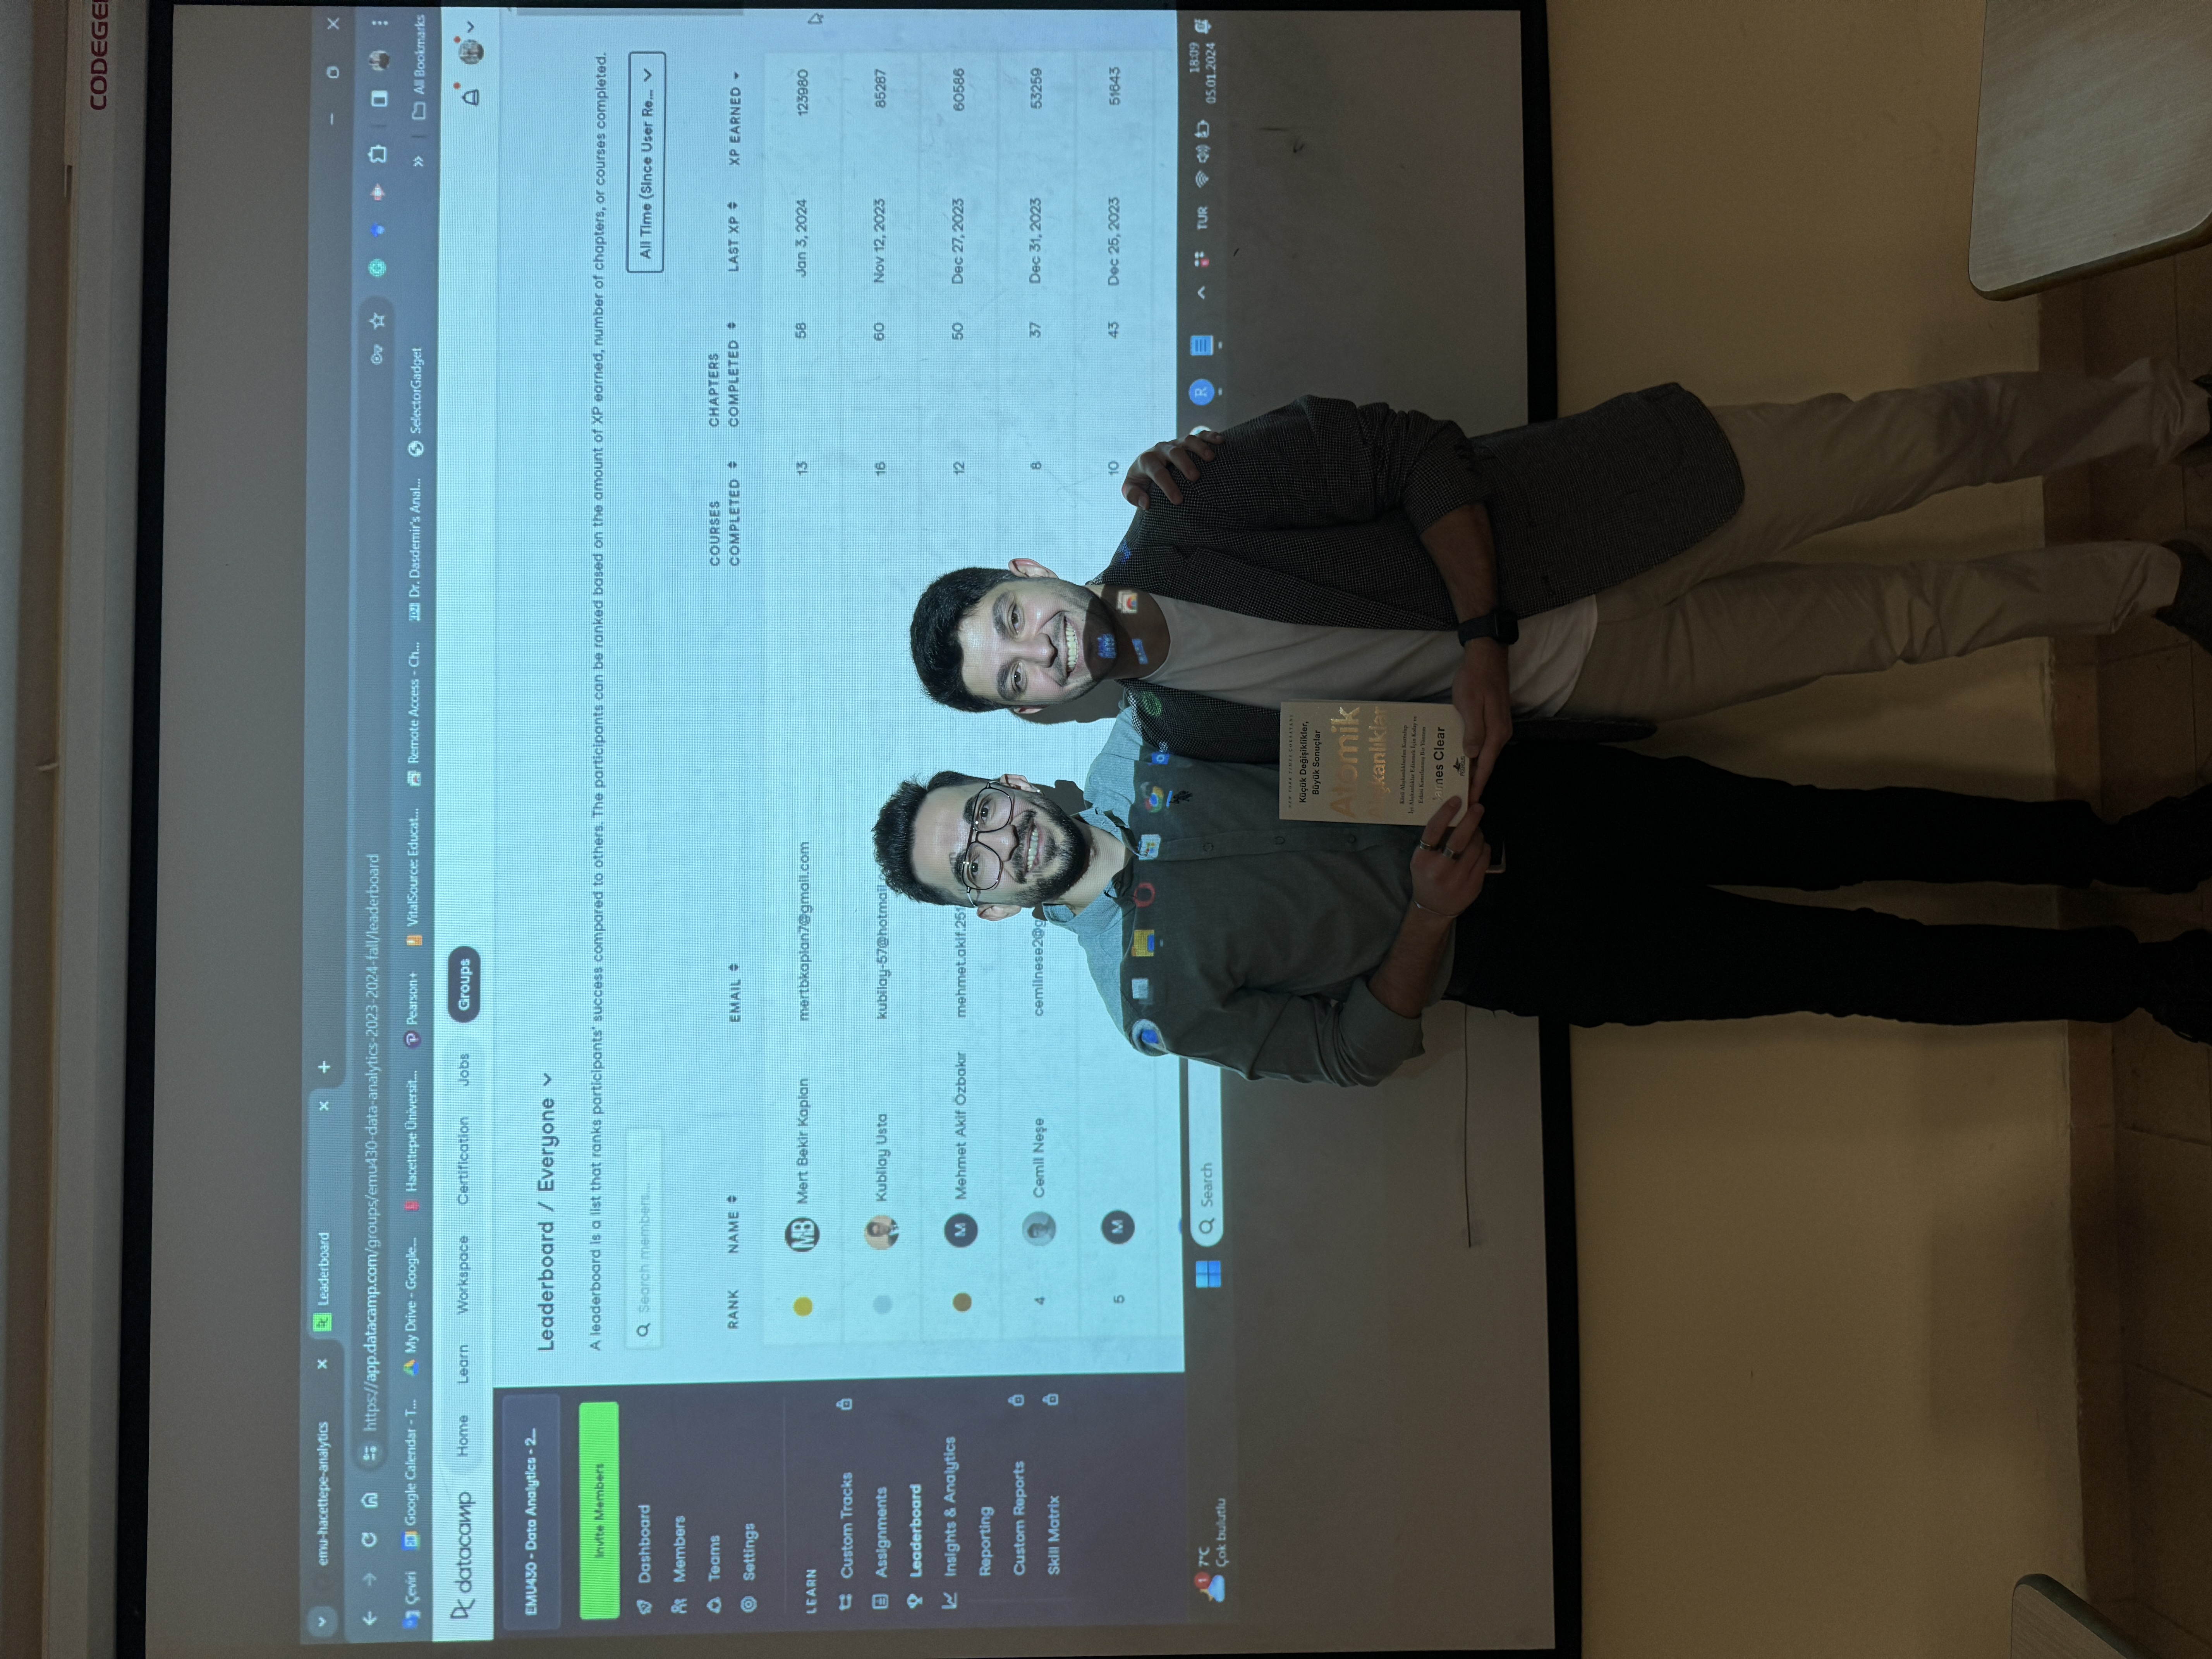
- We began each week by examining the DataCamp leaderboard, evaluating student rankings and monitoring leadership over the last month and the term overall. These moments were enjoyable, and I believe they were well-received by the students.
- On average, about 35 students completed each assignment, indicating that half of the class took advantage of this learning opportunity.
- The end-of-term feedback highlighted some students’ concerns about the volume and difficulty of DataCamp assignments, which was intriguing considering the optional nature of these tasks.
- Mert Bekir Kaplan concluded the term as the leader. We celebrated his achievement at the term’s end and awarded him a gift (Mert and I are in the photo).
Slack
At EMU Hacettepe, we’ve recently adopted Slack as our primary communication tool with students and alumni. This term, I took a step further by integrating Slack into my courses, creating specific channels within our department’s Slack server for class interactions. This move aimed to replace traditional, fixed office hours with a more flexible, always-on communication channel via Slack. Additionally, the platform facilitated peer awareness and support for problem-solving among students. Out of the 73 students enrolled, 51 participated in the Slack channel. Feedback collected at term’s end confirmed that students found this communication strategy exceptionally useful. While similar engagement could potentially be achieved through educational platform forums like Moodle, Slack’s familiar, user-friendly interface made it a more effective choice. The benefits of leveraging Slack included:
- Direct query engagement where I, or often peers, provided answers, significantly reducing redundant queries.
- Enhanced awareness among students regarding their peers’ challenges.
- Identification of previously unnoticed issues by students.
- Rapid and efficient communication between students and myself.
- Avoidance of the clutter typically associated with email communication, with all interactions and files centrally located and easily accessible.
- Obviated the need for physical office hours.
- Motivated students who were unable or unwilling to attend physical office hours to engage and solve their issues, thereby minimizing course fail rates.
Assignments and Term Projects
We strived to make the course interactive, collaborative, and aligned with the latest trends in data analytics by utilizing various productivity tools. Following the approach I detailed in the GitHub section, I had all students create personal web pages for their assignments and projects. This was an integral part of their first assignment. The students published their assignments on these web pages, and these assignments, along with their code, were made publicly available on EMU Hacettepe Analytics, accessible to their peers. This openness was intended to foster one of our key objectives: peer learning, a unique feature of the university environment. Concerns might arise about students copying work from one another. However, I opted to place my trust in my students, as trust has been one of my guiding principles from the start of my career. Misuse was rare, if not non-existent. After all, the course is elective, and the essence of learning comes from engagement, not avoidance.
Students performed exceptionally well both on individual and team projects. Our GitHub Classroom area, EMU Hacettepe Analytics, hosts individual student and project pages for the Fall 2023-2024.
Individual Student Pages
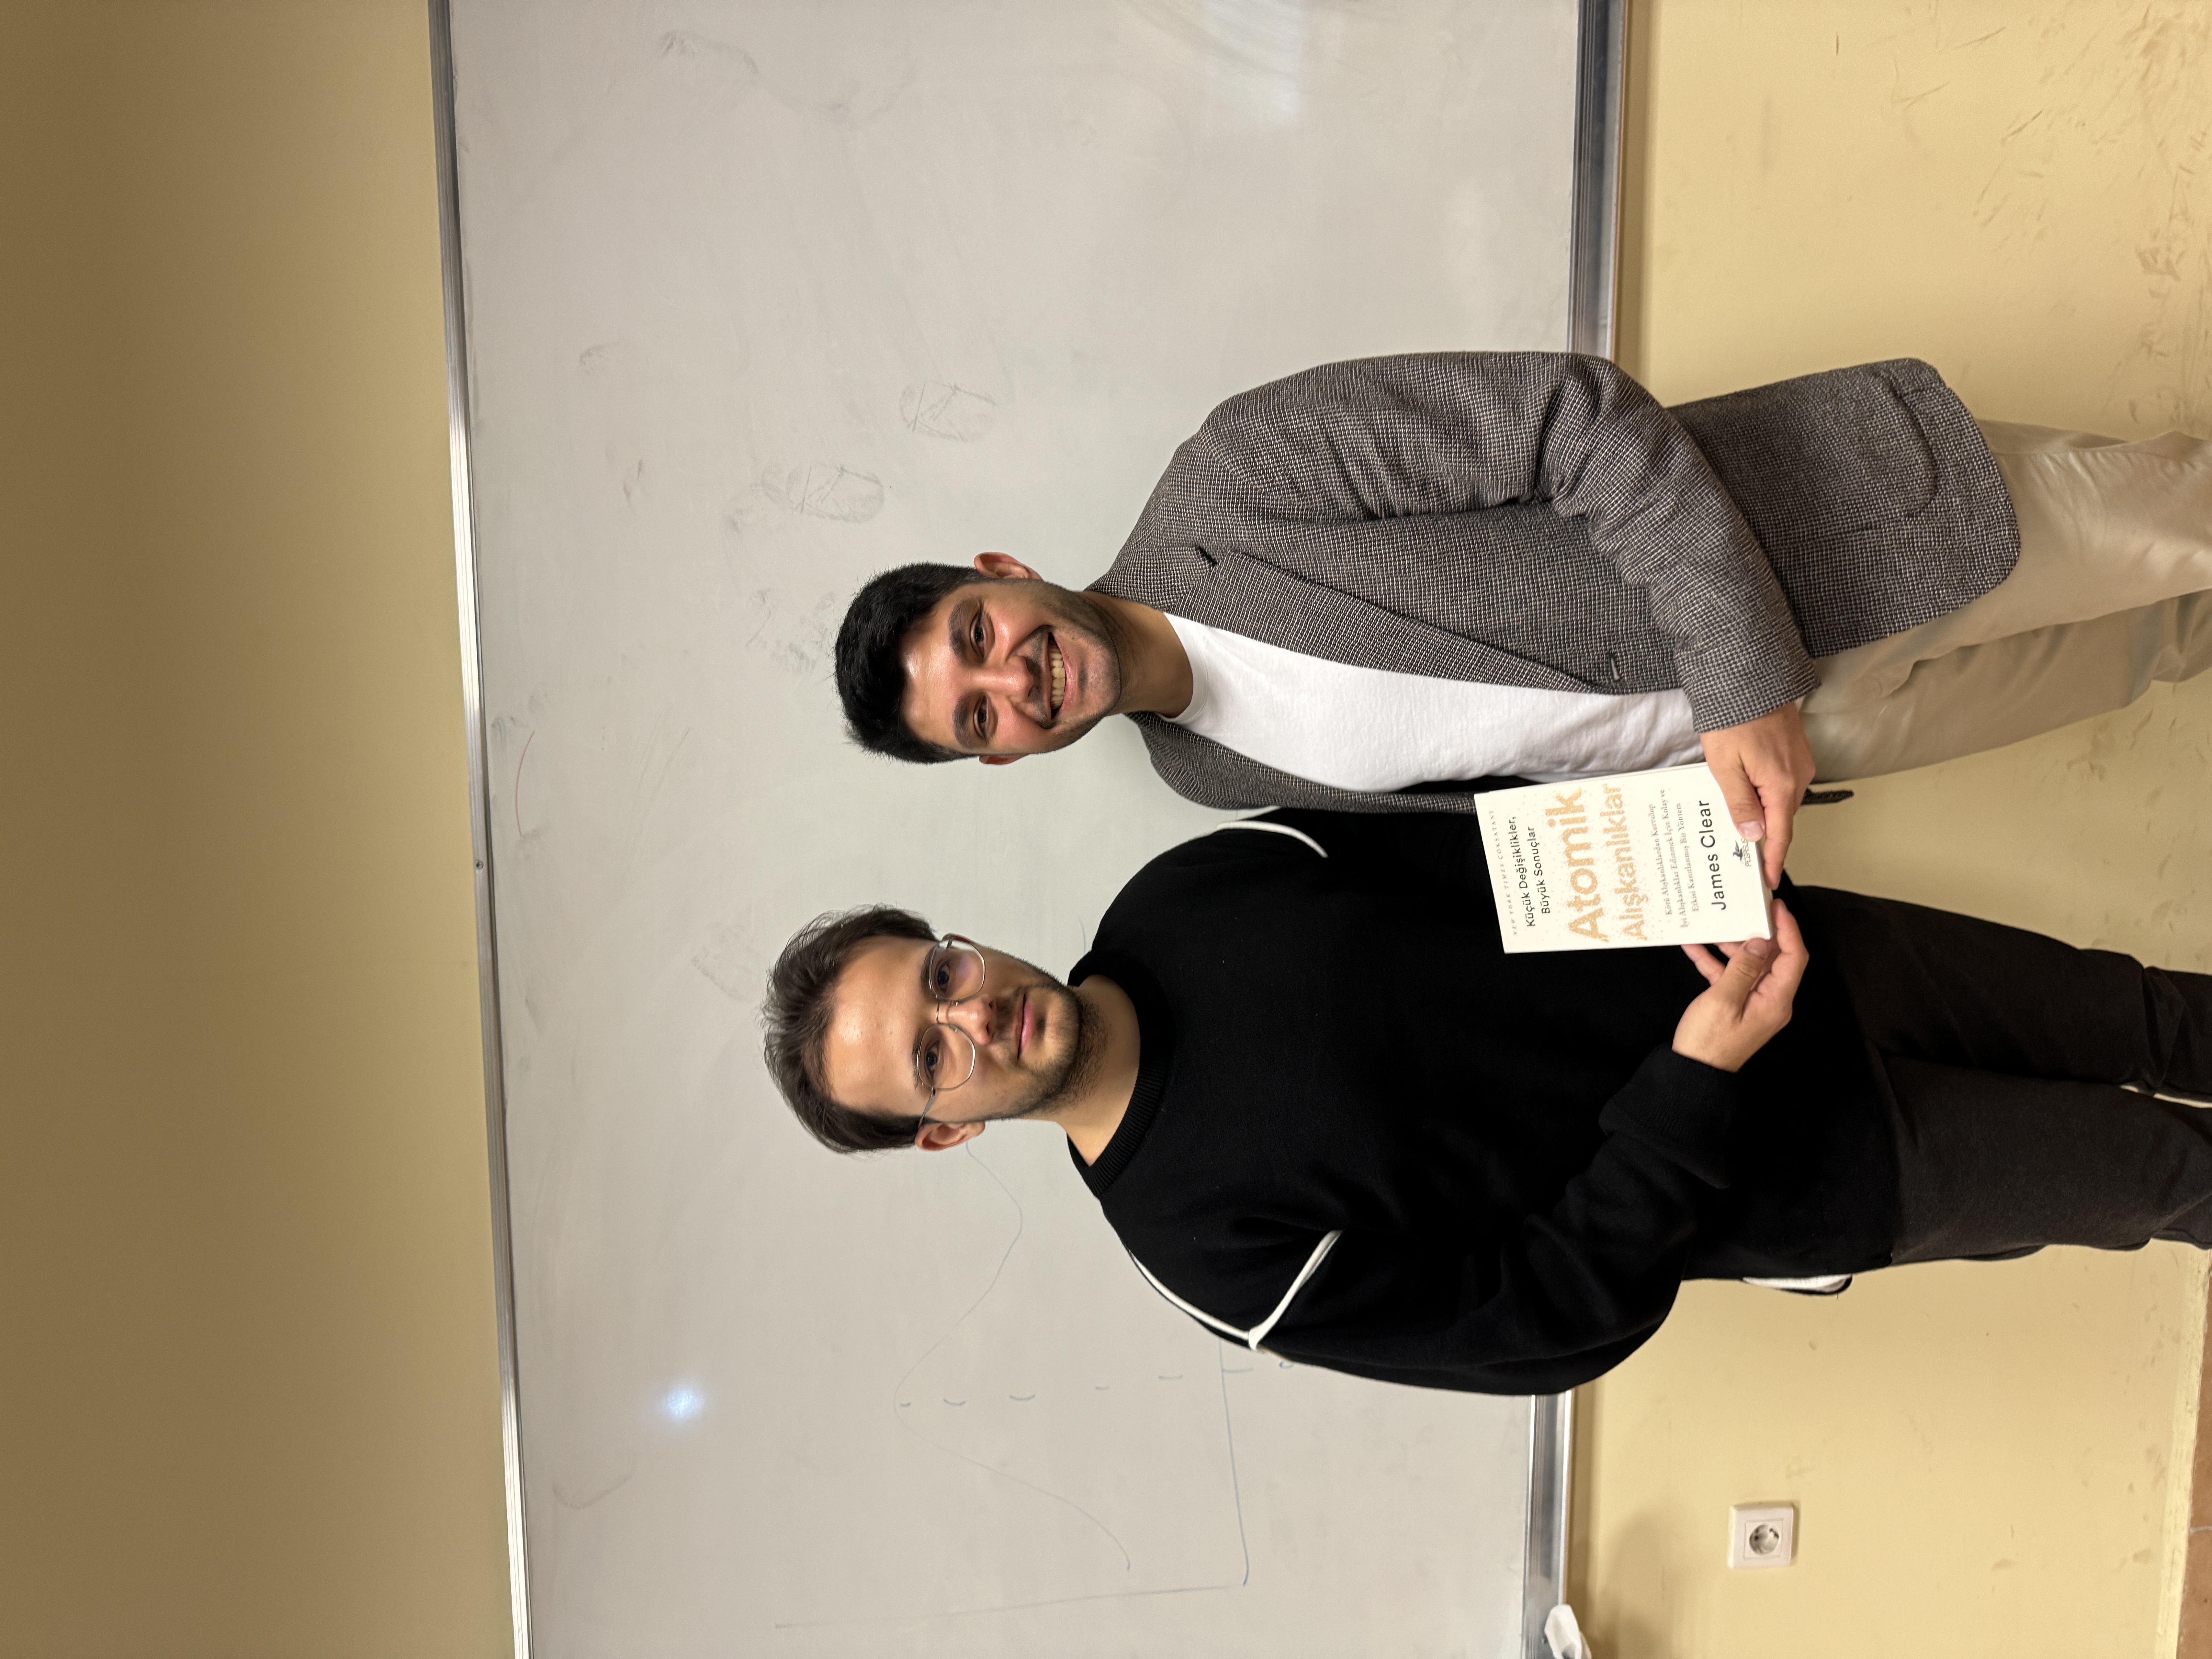
Out of 73 students, several excelled in personalizing their websites with exceptional design and content. I’m highlighting three notable examples below. Aykut Simsek, who stood out for his meticulous attention to his website throughout the term, received a book from me as a gift at the semester’s end (Aykut and I are in the photo).
- Aykut Simsek - www.aykutsimsek.net (Aykut took the extra step of purchasing a domain name for his site.)
- Mert Kaplan’s Analytics Lab
- Sena Nur Enşici’s Analytics Lab
Projects
The term projects resulted in unexpectedly high-quality work from the students. Below are the project pages and the issues they addressed. The first four were my favorites, but most are worth exploring.
-
Team Safe Istanbul This project aims to identify districts in Istanbul at high risk for earthquakes by analyzing three datasets obtained from the Istanbul Metropolitan Municipality. Utilizing data on the number of buildings, construction years, number of floors, and population, the team created a risk map to prioritize neighborhoods for earthquake preparedness.
-
synergy Focused on the cultural sector, this project examines statistics of libraries and museums across cities in Turkey. By analyzing visitor numbers, registered users, and book counts, the team aims to assess the utilization of cultural institutions and identify areas needing development.
-
CTRL-S This project explores the competitive landscape of mobile communication technologies and the market shares of global mobile suppliers, focusing on how national dynamics influence market positions.
-
Data Ciphers Using the Turkey Health Survey, this project analyzes health indicators, disease prevalence, alcohol consumption, and body mass indexes to shed light on national health trends and contribute to international health comparisons.
-
data_vizards Analyzing Turkey’s 2021 internal migration data, this project aims to understand migration trends, demographic factors, and economic indicators to comprehend regional migration patterns and their outcomes.
-
EMUTrend Explorers This project examines student preferences for Industrial Engineering departments in Ankara universities, focusing on demand and placement trends using the YÖK ATLAS dataset.
-
icaRdi The project investigates the relationship between team performance metrics and aims to identify metrics that significantly affect team rankings.
-
semicolon Focusing on developing suicide prevention strategies among different age groups and genders, this project aims to identify effective approaches to reduce suicide rates.
-
4k1e_rda Examining crime data from 2011 to 2020, focusing on the gender and education status of offenders, this study analyzes crime trends using data from the Turkish Statistical Institute.
-
mission prediction This study analyzes the potential impacts of a hypothetical 7.5 magnitude earthquake in Istanbul on infrastructure and population, aiming to guide local authorities and emergency response teams in enhancing the city’s resilience and preparedness.
-
red_flag By analyzing and comparing Consumer Price Index (CPI) data from Turkey and the USA, this project aims to understand inflation trends and the economic and sociological factors influencing these trends.
-
Altı Üstü Data Investigating the relationship between air pollution and forested areas, this study uses PM10 levels and forest area per square kilometer data to analyze and understand the impact of forested areas on air quality.
-
data_criminals A direct project aiming to understand the correlation between education levels and crime rates.
-
Germen Obasi Using TUIK data from 2003 to 2022, this study investigates the relationship between education and happiness, exploring the correlation between education status and levels of happiness and demonstrating the potential independence of these factors.
-
Quant Flare This study analyzes Turkey’s population growth rate and the number of foreign births based on TUIK data, aiming to understand demographic changes and their impacts on Turkey’s future.
Photos


Leave a comment